











In 2025, more than one in four Australian students received an educational adjustment for disability. For education departments this raises increasingly important questions: where and why is demand growing, can workforce capacity keep pace and are student outcomes improving? We explore how education departments can use data they hold to better understand support demand, workforce capacity and student outcomes.
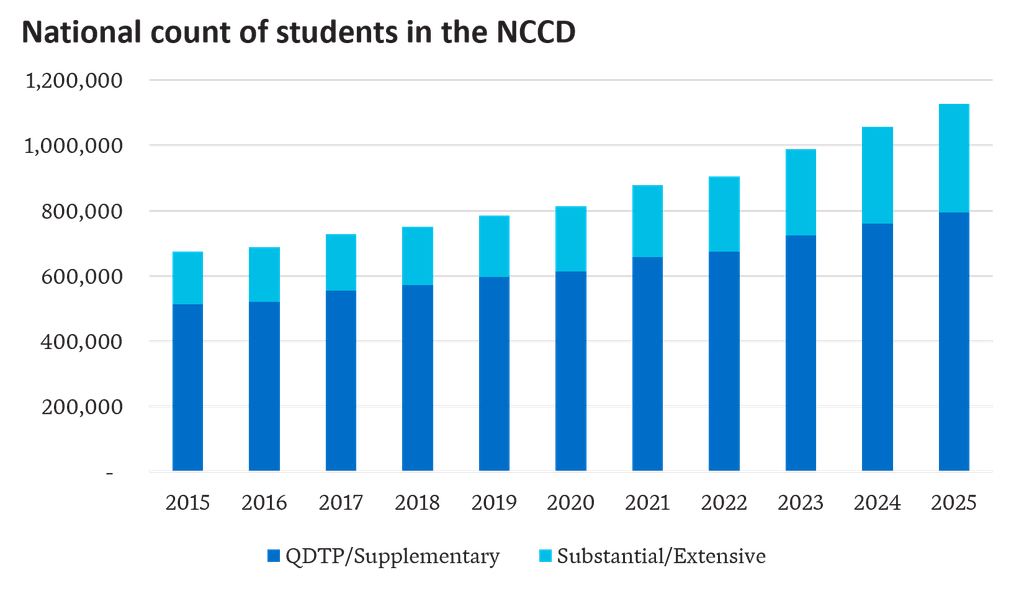
The latest public release of the Nationally Consistent Collection of Data on School Students with Disability (NCCD) indicates part of the story. It shows continued growth in the number of students receiving educational adjustments for disability, including high levels of adjustment.

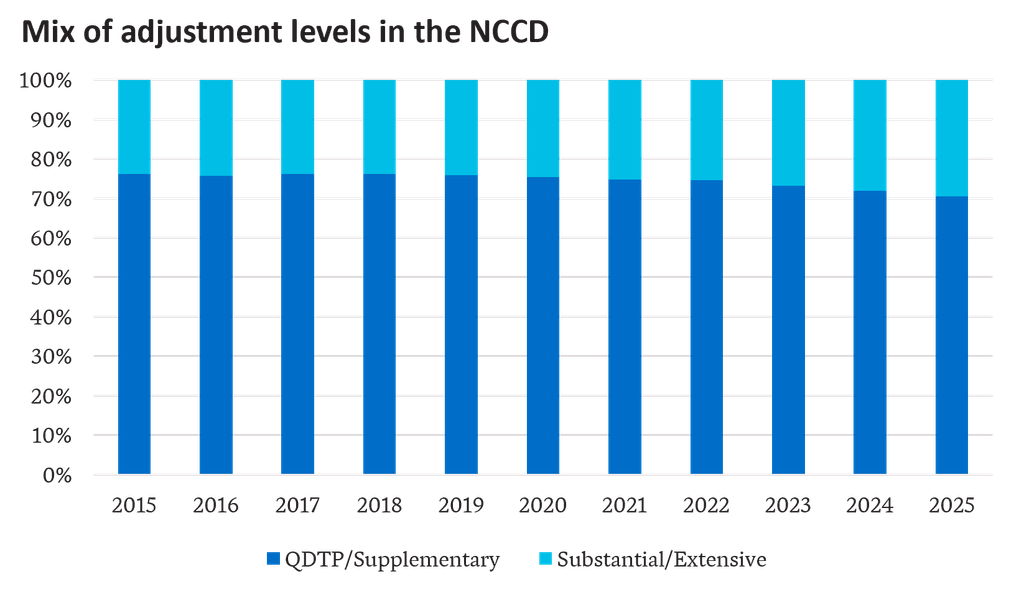
Nationally, the share of students receiving educational adjustments rose from 18% in 2015 to 27% in 2025. Growth has not been confined to lower-intensity support – the share of all students receiving substantial or extensive adjustments increased from 4.3% to 8% over the same period. The category mix has also shifted, with cognitive and social-emotional disability accounting for most reported adjustments and driving the largest increases.
Planning for growing support needs
The Commonwealth student with disability loading under the Schooling Resource Standard (SRS) is calculated from the NCCD – with supplementary, substantial and extensive adjustments attracting additional funding. Growth in students recorded in the NCCD has funding implications. In 2026, the loading is estimated at $5.1 billion, around 15.2% of Australian Government recurrent school funding. Growth in students receiving adjustments may also have workforce implications for schools and school-systems, particularly where additional or more specialised support is required.
NCCD growth should not necessarily be interpreted as a direct measure of clinical disability prevalence. NCCD reporting is shaped by the broad definition of disability in the Disability Discrimination Act 1992, the adjustments schools provide, professional judgement and the changing level of school understanding of the collection. Similar patterns are evident beyond the NCCD: ABS data also show a marked rise in reported disability among children and young people between 2018 and 2022, including increased reporting of autism, ADHD and other developmental, behavioural and emotional conditions. The expansion of the NDIS has further increased the scale and visibility of formal disability support, although NDIS participation and NCCD inclusion measure different things.
Regardless of the precise mix of changing need, improved recognition and reporting practices, the planning challenge remains the same. Departments would benefit from a clear understanding of future demand for adjustments and support, what staff levels schools actually deploy to support students with disability and whether investment is improving outcomes for students.
What data can tell us
These questions should not be examined separately. Bringing existing data together can help education departments develop a clearer understanding of demand, delivery and outcomes. We detail three practical uses of data for education departments to consider.
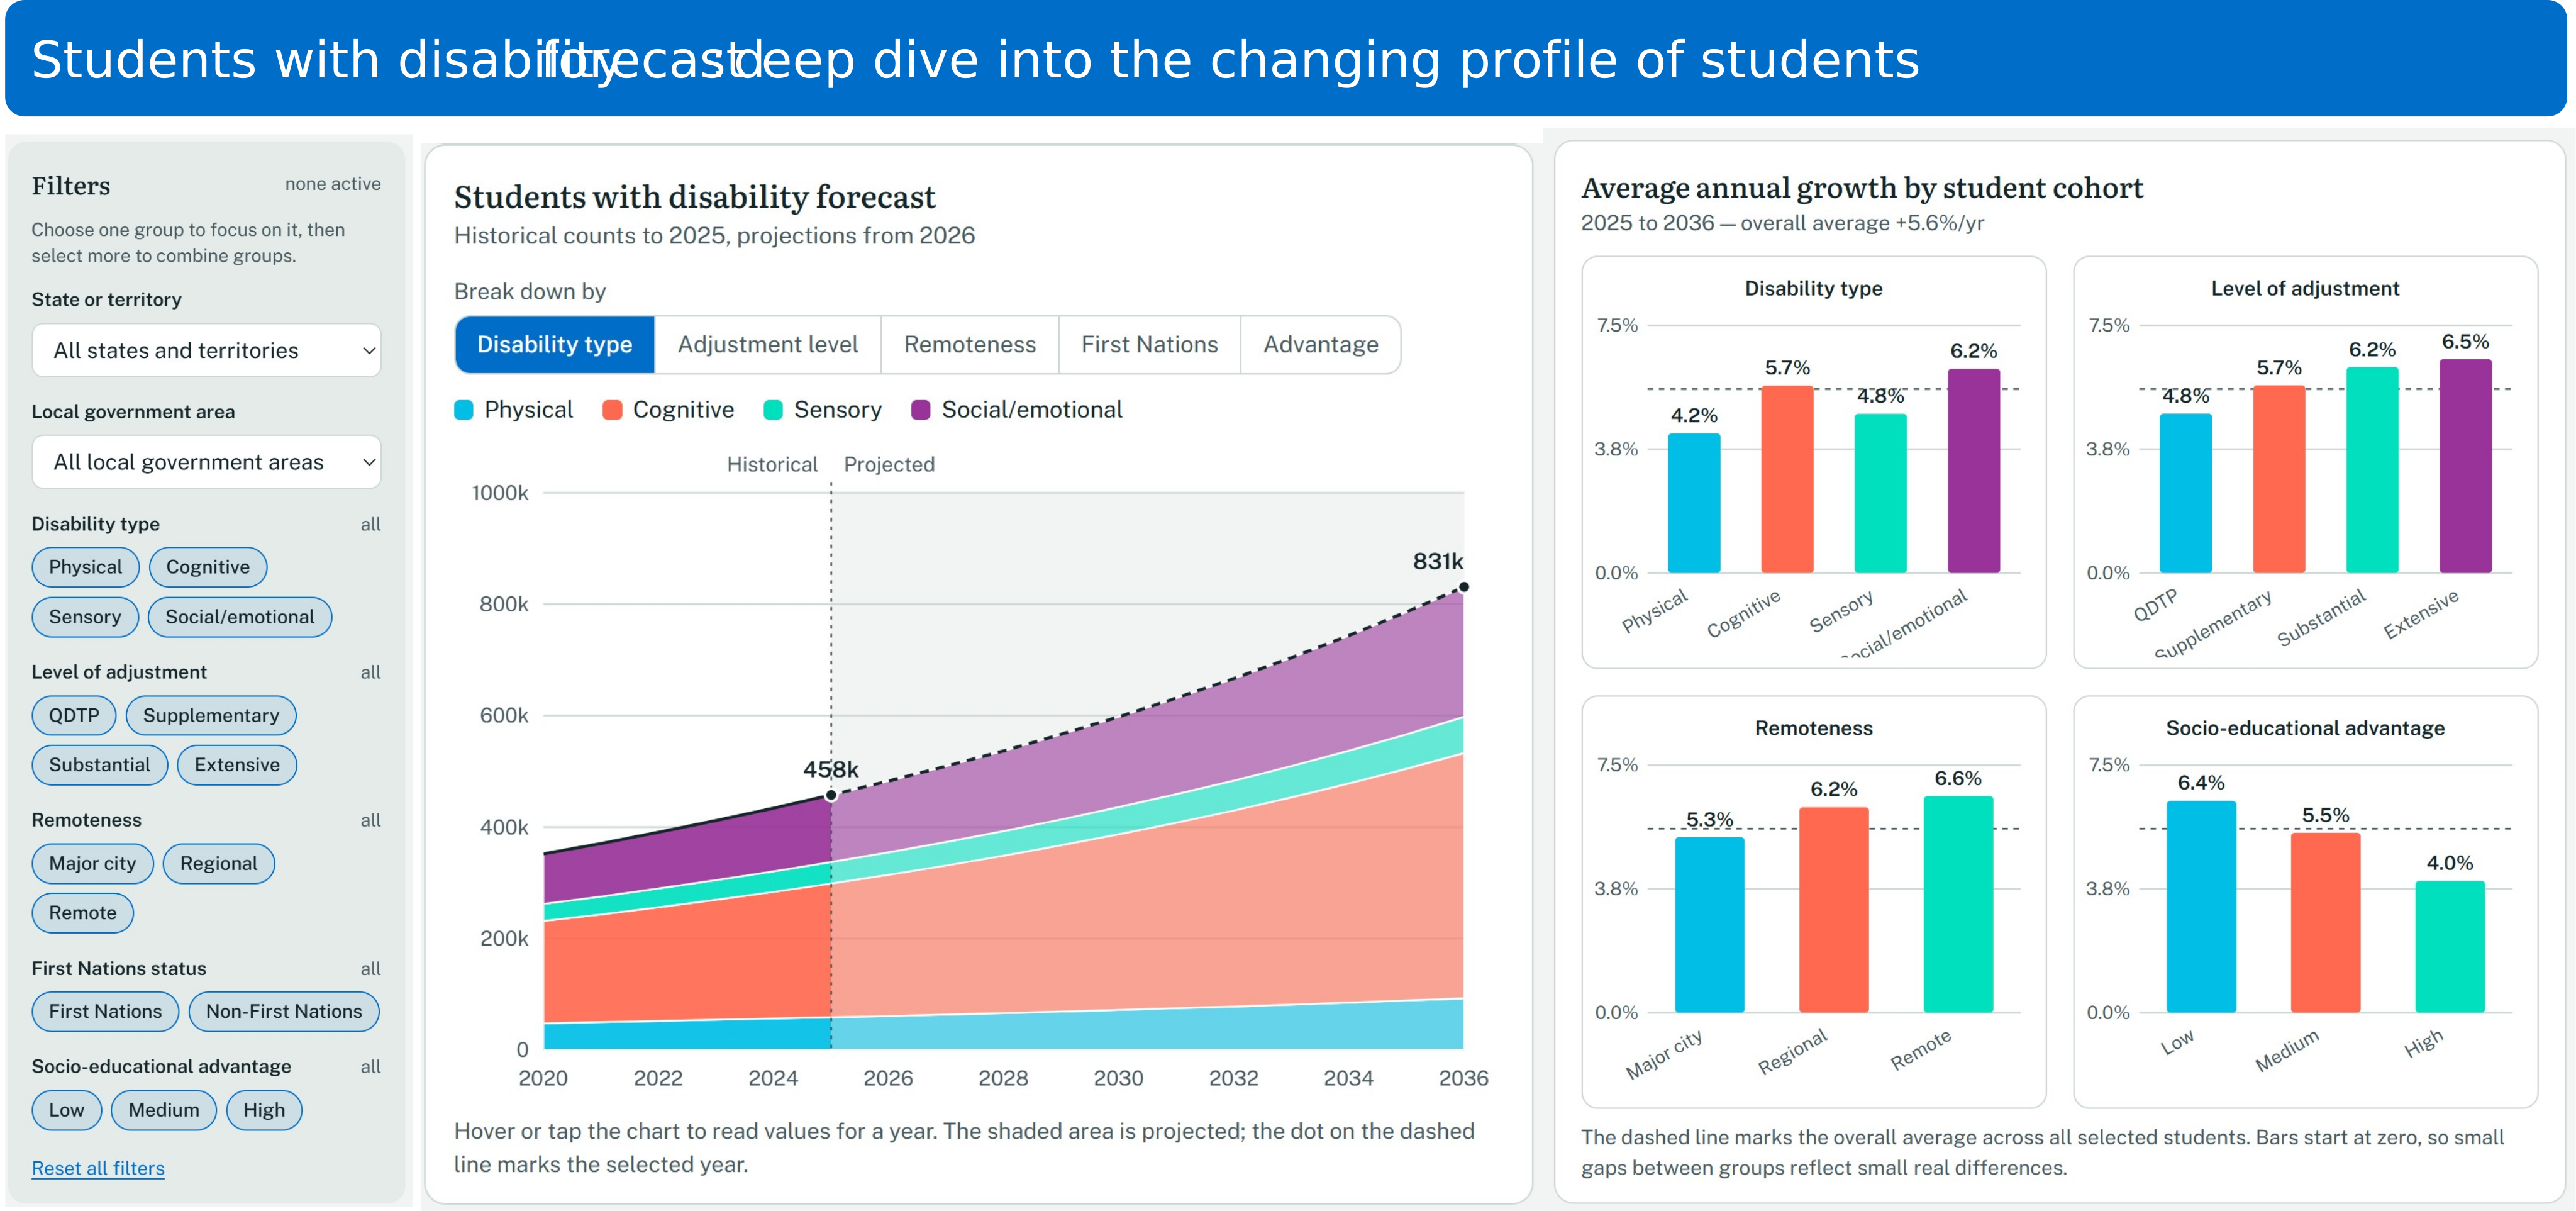
1. Forecast and monitor NCCD trends and support requirements
While annual NCCD reporting provides an important snapshot, NCCD and enrolment data can also be used to develop a forward-looking view of likely support requirements. This view would support insight into:
- Where is growth occurring?
- How patterns differ by region and school setting?
- What those trends may imply for funding and resource allocation?
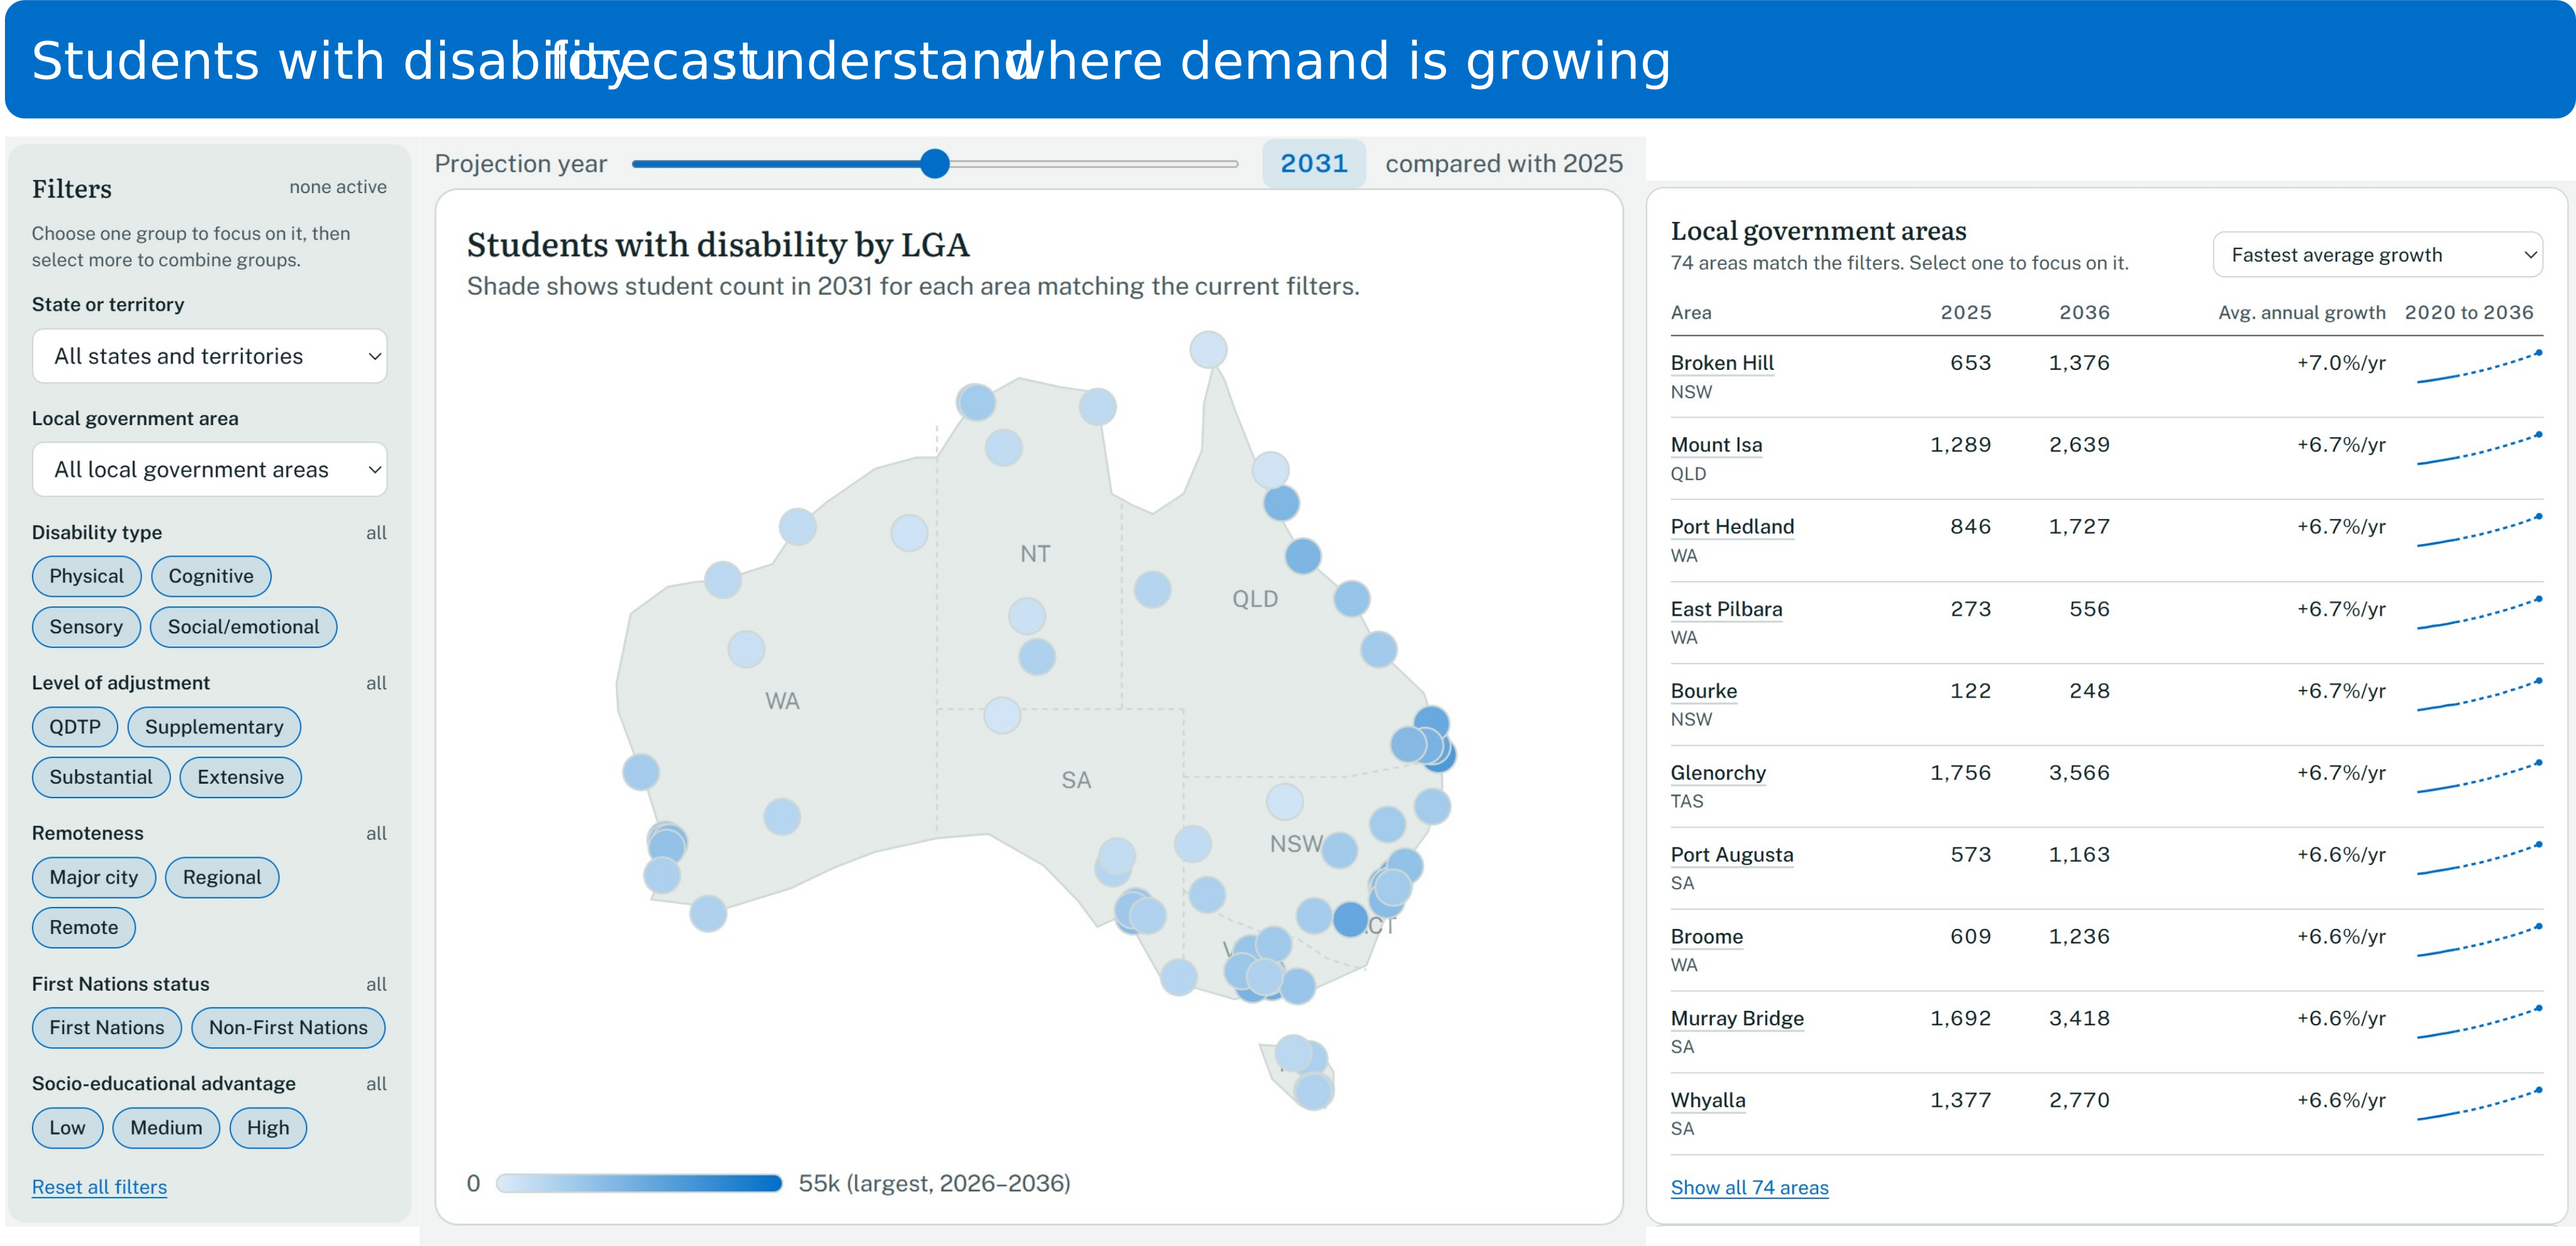
A demand model combining enrolment forecasts with NCCD trends can be used to project likely support requirements over a three- to five-year horizon. Whilst scenario analysis using this model can be used to test various situations to aid decision making.
For example, the model can be constructed to reflect the mechanics of each jurisdiction’s funding and resource-allocation arrangements. This could allow departments to forecast the financial and staffing implications of different scenarios and policy settings, and routinely reconcile those forecasts with actual experience. Monitoring forecast and actual demand together can help identify emerging patterns and unexpected shifts early enough to inform budgets, workforce strategies and allocation settings.
Illustrative examples of monitoring with dummy data:
2. Using payroll data to understand the workforce schools actually deploy
Funding and resourcing models determine the resources schools are notionally allocated to support students with disability. They do not show what schools were actually able – or chose – to put in place. A school may leave an allocated position unfilled, purchase additional FTE from its cash budget, substitute an aide for a teacher, rely on temporary staff, share a specialist across schools or reshape its staffing profile around local workforce shortages. The difference between notional and actual capacity is often a missing piece in inclusive education planning.
Trying to close that gap through precise finance-to-student attribution is unlikely to succeed in the near term. Commonwealth recurrent funding is not required to be spent in fixed amounts on individual students. Schools may pool base funding, equity funding and local resources, while staff may support several cohorts or combine universal and targeted functions.
However, payroll data may be a practical starting point to support a better understanding of how schools deploy funding. Linked over time and combined with additional data such as student cohort profiles and recruitment records, payroll can provide a longitudinal view of system capacity. This is best treated as system-level intelligence rather than a direct measure of individual student support or school performance.

The Queensland Audit Office’s report Attracting and retaining teachers in regional and remote Queensland illustrates why this matters. The audit found principals can reshape staffing profiles and employ staff outside central allocations, producing many different workforce configurations. It concluded the resourcing model was not a reliable workforce-planning baseline and demonstrated the gap by comparing allocated staffing with actual staffing calculated from payroll data.
Payroll alone cannot provide a complete picture of service delivery, but used in this way, it could provide a foundation for understanding the workforce. It can show how workforce capacity is changing and where actual staffing differs from the assumptions embedded in central allocation models.
Payroll also has clear limits. Job titles are imperfect proxies for function: an aide may support several cohorts, while classroom teachers may undertake substantial inclusive-practice work without an inclusion-specific title. Payroll cannot show which student was supported, how staff time was divided, the quality of practice or whether a staffing model improved outcomes.
Even with these limitations, comparing actual and notional FTE would potentially give departments a more detailed view of workforce capacity and how resources are implemented across schools. The analysis is best used as system intelligence – to identify patterns for further investigation and inform workforce planning – rather than as an assessment of school operations, performance or compliance.
3. Applying mixed-methods to measure outcomes, while recognising attribution is complex
Monitoring demand and workforce is important, but the central question is whether students with disability experience better participation, learning, wellbeing and inclusion.
Causal links between disability funding and outcomes, such as NAPLAN test results, would be difficult to establish. Funding is pooled, schools use different staffing and service models, students receive multiple supports at once, needs vary substantially and effects may take time to emerge. Students receiving the most intensive support are also likely to have the greatest needs, making simple comparisons especially misleading. The Productivity Commission has highlighted wider data and reporting gaps for students with disability.
We believe an appropriate alternative is to use a broader and more realistic framework that brings together evidence at different levels. At the system level, indicators can monitor attendance, participation, suspensions and exclusions, retention, transitions and NAPLAN participation. At the school level, evaluation could examine inclusive culture, leadership capability, staff confidence and the implementation of evidence-informed practice. At the student level, progress against well-specified individual learning and support goals provide a closer measure of whether adjustments are working than standardised achievement alone.
A framework for understanding outcomes could combine three methods:
- Routine quantitative monitoring to identify patterns, differences and changes over time
- Targeted comparisons of schools or cohorts with similar student profiles but different staffing and support models
- Case studies, student and family voice, principal and staff surveys, and implementation reviews to explain what the numbers alone cannot.
This mixed-method approach allows departments to test whether investment is contributing to a stronger culture of inclusion, more effective leadership, greater teacher capability and better implementation of adjustments. It also creates a feedback loop: outcomes evidence can inform funding models, workforce initiatives and professional learning without claiming a level of causal precision the data cannot support.
The next phase of inclusive education
Education departments already hold much of the data needed to build a clearer view of inclusive education:
- A demand forecast and monitoring report using NCCD and enrolment data
- A payroll-based workforce scan comparing actual staffing with notional allocations
- An outcomes dashboard supported by a targeted program of surveys, case studies and evaluation.
Reviewing the three components together could show where the system is under pressure and why. Increased funding without corresponding growth in actual staffing could indicate a recruitment or implementation issue. Additional staffing without stronger outcomes may indicate challenges with role mix, practice quality or leadership. If schools consistently purchase different roles from those assumed in the department’s resourcing model, the model itself may need revision.
No single analysis will provide perfect answers, but together they are a step towards a clearer understanding of how student need translates into resources, support and outcomes. And we believe it provides a useful platform for managing the next phase of inclusive education reform.